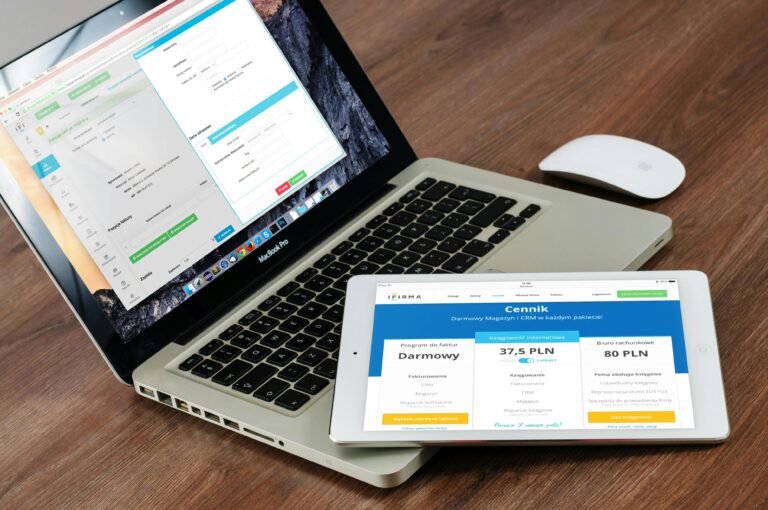

Conversion-focused websites are critical for 2024–2026: industry benchmarks show that average site conversion rates hover around 2–3% (across industries), but top performers achieve 5% or higher. Conversion Rate Optimisation (CRO) is growing fast (CRO software market is projected to hit ~$1.9 billion by 2026) and involves data-driven tactics like A/B testing, persuasive UX/UI design, and continuous iteration. Key trends include mobile-first design (mobile traffic ~64–75% of all visits), Google’s emphasis on Core Web Vitals (fast loading, smooth layouts), and AI-driven personalization (real-time content adaption and predictive testing). Accessibility and inclusive design ensure reach and legal compliance. This guide will outline the latest best practices — from UX/UI patterns and persuasive copy to analytics and SEO structure — illustrating each with data and mini case studies. We also provide an outline, suggested meta tags, CTA examples, and tables of tools, templates, and KPIs. The goal: equip your team to build a website that delights users and maximises conversions.
Table of Contents
Up-to-Date Trends & Data (2024–2026)
- Rising CRO Focus: Search interest in “conversion rate optimization” is at an all-time high. Conversion optimization is a priority: 79% of marketers say generating quality leads is their top focus. Yet only ~17% run regular A/B tests, so many sites lag behind.
- Industry Benchmarks: According to Matomo and Invesp analyses, the average site converts ~2.3–3.3%. The top 25% of sites hit ~5.3%+. In e-commerce, averages are ~2.5–3%. Small lifts yield big gains: tripling a 1% rate to 3% triples revenue.
- Bounce Rate: High bounce is costly: average bounce is ~50.9% (ranges vary by industry). Designing to keep users engaged is critical.
- Mobile Growth: As of 2025, ~64–75% of web traffic comes from mobile devices. Mobile-first design is mandatory: mobile-optimized sites see ~23% higher conversions and ~67% lower bounce vs desktop-only. Google now ranks pages by mobile page experience (mobile-first indexing).
- Core Web Vitals: Google’s performance metrics (LCP, FID/INP, CLS) are ranking factors in 2024–2026. Every extra second of load time can cut conversions by up to ~20%. Fast, stable pages are a must for CRO.
- AI and Personalization: AI/ML technologies are transforming CRO. Predictive tools analyze user data in real time to adapt content (AI chatbots, dynamic CTAs, multi-armed bandits for testing). Gartner predicts AI-driven personalization will be mainstream by 2026. Personalization boosts relevance: sites using real-time behavior data (not just demographics) see higher conversion lift.
- Inclusive Design: There’s growing emphasis on accessibility and inclusive UX. Beyond legal compliance, accessible sites (alt text, captions, keyboard nav, high contrast) reach more users and improve SEO. Inclusive design (accommodating culture, language, age, abilities) leads to broader engagement.
Conversion Rate Optimization (CRO) Best Practices
Adopt a systematic, data-driven approach to turn visitors into customers. Core practices include:
- A/B & Multivariate Testing: Continual experimentation is the backbone of CRO. Test one element at a time (A/B) or sets of elements (MVT) with proper statistical significance. Use tools like Optimizely, VWO, Google Optimize (now GA4), or AB Tasty. Maintain a testing log of hypotheses and results. Expect iterative lifts of ~10–50% from validated changes.
- Simplify & Remove Friction: Streamline user flows (signup, checkout, forms). Reduce steps, fields and distractions. Simplification often yields the biggest wins (20–50% lifts). For example, a one-page mobile checkout instead of multi-step can cut cart abandonment significantly.
- Clear Value Proposition: The headline/subheadline must instantly answer “What’s in it for me?”. Use specific, benefit-oriented messaging (e.g. “Reduce invoicing time by 50%” vs vague claims). Place your core promise above the fold and repeat consistently across ad landing pages. Companies like Stripe nail this with simple, audience-focused taglines.
- Optimized CTAs: Your Call-to-Action button is the conversion linchpin. Use action-driven, user-centric text (“Start my free trial” vs generic “Submit”). A small copy change to first-person wording can double clicks. Visually, make the CTA button contrast strongly with the page (bright color, whitespace) and place it prominently above the fold and at key points down the page. Limit to one primary CTA per screen; secondary links should be styled subtler.

- Image: Example of a prominent, contrasting CTA (“Get Started” button) on a website, illustrating clear visual hierarchy and actionable copy.
- Social Proof & Trust Signals: Reduce user anxiety by showing testimonials, reviews, usage stats or badges. Authentic quotes with names/photos and numbers (“250,000+ businesses use us” as on Asana) dramatically boost trust. Place testimonials and trust badges near CTAs or on key pages (homepage, pricing, checkout) to validate the decision. Quantify testimonials (“+40% leads”) for credibility.
- Speed & Performance: Optimize every millisecond. Compress images (WebP/AVIF), minify code, use lazy loading, and a CDN. Aim to load above-the-fold content first. Track Core Web Vitals (LCP, FID/INP, CLS) as they directly impact SEO and UX. Fast, responsive pages signal quality and prevent bounces. For instance, Walmart found each 1-second speed gain gave a 2% conversion bump. Flutebyte notes research showing a 20% drop in conversions per extra second of delay.
- Mobile Optimization: Design for mobile first. Over half of visits are mobile (even higher in retail/social). Adopt a mobile-first philosophy: prioritize essential content and navigation on small screens. Make buttons large/tappable (≥48×48px) and forms thumb-friendly. Test on real iOS/Android devices, not just emulators. A well-executed mobile design can lift mobile conversions by ~20–60%.
- Persuasive Copywriting: Words sell too. Lead with benefits (“Save 5 hours weekly”) rather than features. Use vivid, specific language (“25% more leads” not “significantly more”) and power verbs (“Transform”, “Proven”). Address objections directly (“No credit card needed”, “Money-back guarantee”) to ease fear. Structure landing page copy like a narrative: outline the visitor’s problem, present your solution, list key benefits, and end with a clear CTA. For example, Basecamp boosted conversions by agitating the pain (“the chaos of disorganized projects”) then offering calm.
- Personalization & Segmentation: Today’s users expect tailored experiences. Serve different content to segments (new vs returning, industry, location) using dynamic tools. E-commerce sites can show personalized product recommendations or targeted discount popups. In 2025, hyper-personalization (using behavior, not just cookies) is key: AI can detect if a visitor lingers on pricing and dynamically offer a promo or chatbot assistance. This relevance boosts engagement, average order value and repeat visits.
- Data & Continuous Testing Culture: Embed analytics and experimentation in your workflow. Implement GA4 event tracking, funnel analysis, and qualitative tools (heatmaps, session recordings). Identify biggest drop-offs and prioritize them using frameworks like PIE (Potential-Impact-Effort). Run tests sequentially with clear hypotheses (see table below). Document and share results across teams. Over time this data-driven loop compounds, delivering cumulative gains.
UX/UI Patterns to Increase Conversions
Good design guides users naturally toward your goals. Key UX/UI strategies include:
- Strong Visual Hierarchy: Use size, color and layout to draw attention. Typically place the most important message and CTA in the “hotspot” (top-left or center of hero section). Follow an F- or Z-pattern for scanning content. Bold fonts for headings, contrasting colors for action items, and ample whitespace help prevent clutter. For example, a page might start with a full-width hero banner (headline + CTA) followed by a two-column “feature-benefit” section. Ensure primary CTA buttons stand out (eye-catching color) while secondary links are subdued.
- Grid and Modular Layouts: Use grid systems to organize content blocks predictably. Modular “cards” or sections (e.g. feature boxes with icon + heading + text + CTA) help users digest information quickly. This also supports A/B tests: swapping modules is easier than redesigning freeform layouts.
- Template Examples: Common high-converting templates include:
- Landing Page (Lead Magnet): Hero (compelling headline + subhead + image), key benefits, testimonial, lead-capture form/CTA.
- Homepage (Service/SaaS): Above-the-fold intro, “how it works” steps, features section, social proof/logos, pricing teaser, FAQ, footer CTA.
- Product Page (E-commerce): Prominent product images, USP bullets, price, “add to cart” button fixed on scroll, reviews, related products.
- Pricing Page: Clear plan comparison table, highlighted recommended plan, call-outs for popular plan, FAQ, CTA to sign up or contact sales.
Layout consistency (fonts, buttons) across pages builds trust and familiarity. We recommend testing multiple template styles via A/B (e.g. single long page vs multi-section scroll) to see what your audience prefers.
- Microinteractions: These are small animations or feedback that make the experience feel alive. Examples: button hover effects, form field checkmarks, progress animations, subtle page transitions. Google research suggests subtle micro-animations make sites feel 5% faster and 8% more enjoyable. For instance, changing a CTA color on hover or showing a live word count as a user types can guide behavior. Progressive disclosure (revealing additional fields as needed) has been shown to raise form completion by ~23%. Clear focus states (visual cues for keyboard/tab navigation) can reduce support tickets by ~15%, aiding accessibility. In sum, thoughtful microinteractions deliver feedback and delight without distracting users, improving engagement and conversions.
Mobile-First & Core Web Vitals Considerations
- Mobile-First Design: Start designing for small screens. Ensure navigation (hamburger/menu), touch targets, and content hierarchy work well on phones. Given ~65–75% mobile usage, anything less hurts conversions. Use responsive images and CSS to adapt layouts. Prioritize critical info (value prop and primary CTA) on mobile views. Remember a non-mobile-friendly site can immediately lose visitors – e.g. one study found pages that aren’t fully mobile-friendly see significantly higher bounce rates.
- Core Web Vitals: Google’s Web Vitals define page performance thresholds. Key metrics: Largest Contentful Paint (LCP) < 2.5s, Cumulative Layout Shift (CLS) < 0.1, Interaction to Next Paint (INP)/First Input Delay (FID) < 100–200ms. These measure load speed, visual stability, and interactivity. Sites failing CWVs may rank lower and discourage users. Use tools like PageSpeed Insights or Lighthouse to audit. Optimize images/fonts (to improve LCP), reserve space for dynamic content (to prevent CLS), and defer non-critical JS (to lower INP). Flutebyte’s analyses emphasize that each Core Web Vitals improvement not only aids SEO but directly boosts user engagement and conversions.
Accessibility & Inclusive Design
Design inclusively to reach all users (disabilities, devices, languages, cultures). Key points:
- WCAG Compliance: Follow Web Content Accessibility Guidelines: use alt text for images, captions for media, and ensure keyboard navigation works (tab order, skip links). Use high color contrast and resizable text for readability. Ensure forms have labels and error messages. These features help people with disabilities and improve general UX (e.g. voice search indexing).
- Inclusive Content: Write in plain language; consider translation/localization if relevant. Avoid cultural biases in imagery or examples. NN/g notes that inclusive design “understand[s] and enable[s] people of all backgrounds and abilities”. For example, allow users to easily switch currencies or languages if serving global markets, and use imagery that reflects your diverse audience.
- Usability Overlays: Provide options like dark mode toggle (beneficial for users with visual impairments) or adjustable font size. Ensure interactive elements (buttons, controls) are large enough and spaced for motor impairments.
Implementing accessibility and inclusive design not only widens your market but can increase conversions, as a site that “works for everyone” loses fewer customers to frustration.
AI-Driven Personalization & Testing Tools
The next frontier is using AI/ML to automate and enhance CRO:
- Predictive Personalization: AI tools analyze user data (past behavior, demographics, session signals) to predict intent and serve dynamic content. For instance, a returning visitor might see personalized recommendations or targeted CTAs (“Welcome back, here’s a premium offer!”). With third-party cookies fading, leveraging first-party data and AI for real-time personalization is key.
- AI-Powered Testing: Traditional A/B splits traffic 50/50, but AI-driven (multi-armed bandit) testing reallocates more visitors to high-performing variants on-the-fly. Tools like Google Optimize (deprecated), Optimizely, or Adobe Target now offer AI testing modes. This speeds up finding winners and reduces lost conversions during tests.
- AI Content Tools: Generative AI (ChatGPT/GPT-4, Jasper, etc.) can accelerate copywriting and ideation. Use AI to draft headlines or CTAs and then A/B test variations. AI can also auto-generate content sections (e.g. product descriptions) based on keywords, though always review for tone.
- Session Analysis & Heatmaps: Platforms like Hotjar, FullStory, or Crazy Egg incorporate ML to identify friction hotspots or rage clicks. They can prioritize usability fixes (e.g. highlighting buttons never clicked). AI chatbots (Drift, Intercom) on-site can engage users, answer FAQs and even guide conversions around the clock.
- Conversational UX: Voice assistants and chatbots are increasingly common. Optimizing for voice (using natural language, question phrases) ensures your site captures voice search traffic and provides intuitive navigation. AI chatbots on landing pages can warm leads by answering queries instantly.
Below is a summary table of useful tools (non-exhaustive):
| Purpose | Example Tools | Notes |
|---|---|---|
| Web Analytics | Google Analytics 4, Adobe Analytics, Matomo | Track traffic, funnels, events |
| Behavior & Heatmaps | Hotjar, Crazy Egg, Microsoft Clarity | Visualize scrolls, clicks; identify UI issues |
| A/B Testing & Optimization | Optimizely, VWO, AB Tasty, Google Optimize | Run experiments on layouts, copy, flows |
| Personalization Engines | Dynamic Yield, Adobe Target, Kameleoon | Serve tailored content/offers, dynamic CTAs |
| Content & Copy AI | OpenAI GPT, Jasper, Writesonic | Generate headlines, CTAs, micro-copy for testing |
| Chatbots/Assistants | Intercom, Drift, Google Dialogflow | Guide and engage users conversationally |
Persuasive Copywriting & CTA Placement
Words and language are a core conversion driver. To optimize copy and CTAs:
- Above-the-Fold Value: The first screen should quickly communicate value. Use a punchy headline and one-sentence subhead above the fold. Avoid jargon; speak in the user’s language.
- User-Centric Language: Address the visitor directly (second person “you/my”). Group107 highlights switching “Start your free trial” to “Start my free trial” boosted clicks by ~90%. Use possessive pronouns and active voice.
- Action-Oriented CTAs: CTA text should clearly state the benefit (“Get Your Free Quote”, “Claim My Discount”). Test first-person vs second-person wording. Highlight benefits: e.g. “Start saving time today” instead of “Learn more”.
- Placement & Frequency: Ensure the main CTA appears above the fold and at logical breakpoints. For long pages (e.g. guides), repeat the CTA after sections or at the bottom. Consider a floating or fixed footer bar on mobile. Always make the CTA stand out visually (use color contrast and whitespace).
- Urgency & Scarcity: Use limited-time offers or deadlines where appropriate (“Limited spots available”, “Offer ends soon”) to create FOMO. Only do this authentically or test credibility, as false urgency can backfire.
- Use of Social Proof Near CTAs: Placing a testimonial snippet or “1,000+ users” badge adjacent to your CTA reinforces trust at the decision point.
Embedding example: Insert a high-contrast CTA button image above and analyse its copy and design.
Visual Hierarchy, Layout Templates, and Microinteractions
This combines earlier sections but emphasizes design flow and engagement:
- Hero Section Template: A common proven layout is a full-width hero with a strong background image/graphic, headline, subtext, and a bold primary CTA. Below, features can be arranged in a grid or zigzag (text-image alternating) layout. According to UX best practices, placing key information in the upper-left and center captures immediate attention.
- Mid-Page Engagement: Break up long pages with visual elements (icons, images), testimonials, and CTAs. For example, use a three-column feature showcase with icons and mini-headlines. Keep all sections mobile-friendly: stack columns vertically on small screens.
- Footer CTA Bars: A subtle yet effective template is a sticky bottom CTA bar on mobile (“Contact us” or “Order Now”) to capture users who scrolled far.
- Microinteractions (continued): As mentioned, add small interactions: button hovers, form field focus effects, loading spinners, etc. Don’t overdo animations (keep them fast <200ms), but use them to signal that something happened (form submitted, menu opened). This makes the site feel more responsive and guides users’ eyes.
Analytics, A/B Testing Frameworks & KPIs
Measuring and iterating is as important as design itself. Key components:
- Event and Funnel Tracking: In GA4 or similar, define events for all conversion steps (button clicks, form submissions, video plays). Set up funnels to see where users drop off (e.g. Homepage → Product Page → Add to Cart → Checkout). Focus on the pages with highest exits.
- KPIs to Monitor: Typical website KPIs include conversion rate, bounce rate, average session duration, pages per session, cart abandonment, and engagement rate. Below is a comparison table of some core metrics:
| Metric | Description | Benchmark/Goal |
|---|---|---|
| Conversion Rate | % of visitors completing target action (purchase, signup) | ~2.35% industry avg; Top sites >5% |
| Bounce Rate | % who leave after one page | ~50.9% avg; lower is better (aim <40%) |
| CTR (Click-Through Rate) | % who click a given link or button | Varies by medium; aim for eye-catching CTAs (5–15% common) |
| Avg. Session Duration | Time spent per visit | Higher = engaged users; track +X% over baseline |
| Pages/Session | Average pages viewed per session | Desktop ~4–7, Mobile ~3; encourage >3 |
| Core Web Vitals | LCP/INP/CLS scores | Google thresholds (LCP <2.5s, CLS <0.1, INP <200ms) |
| Mobile Usability | Errors flagged by Google or Clarity | Aim for 0 errors, 100% score on mobile usability audits |
(Benchmarks from Matomo, Semrush, and Google Dev Docs.)
- A/B Testing Framework: Follow a structured approach: identify problem, form hypothesis (“Simplifying header will reduce bounce”), design variant, run test for full business cycles (2–4 weeks), and analyze for statistical significance. Use an impact/effort matrix (like PIE: Potential, Importance, Ease) to prioritize tests. Document results in a knowledge base. Even “losing” tests are insights.
- Analytics Tools: Core: Google Analytics 4 (or Matomo) for quantitative data; Hotjar/Clarity for heatmaps and recordings; Google Search Console for keyword performance. For more advanced, consider data visualization tools (Data Studio, Tableau) to track trends and report ROI of CRO.
- Data Culture: Ensure all stakeholders (design, dev, marketing) have access to key dashboards. Set up weekly/monthly review of conversion funnels and test backlogs. This instills a continuous improvement mindset.
SEO and Content Structure for Rankings
A high-converting site also needs traffic. Optimize for search engines and usability:
- Keyword-Focused Content: Craft page content around target terms like “high converting website design”. Use the primary keyword in the H1/title, and related keywords in subheads (H2/H3). Write naturally to address user intent (informational vs transactional).
- Headers and Meta Tags: Use one H1 per page; break sections with H2-H4 logically. Incorporate primary and LSI keywords in subheadings. Meta title should include “2026” and main keyword (e.g. “High-Converting Website Design”); meta description should be an engaging summary (up to ~155 characters) with a call to action or benefit. Example (see below).
- Schema Markup: Use structured data (e.g.
BlogPostingorArticleschema) to signal page type to Google (improves SERP appearance). For e-commerce or local businesses, use relevant schemas (Product,LocalBusiness). Validate with Google’s Rich Results Test. - Mobile & Speed Signals: As noted, performance (CWV) and mobile usability directly affect SEO. A fast, crawlable site with logical structure helps ranking.
- Internal Linking and Navigation: Make it easy to find content. Use breadcrumb schema for multi-level sites. Link related articles/posts within content. Every page should be reachable within 3 clicks from home.
- Metadata & Alt Text: Fill image alt tags with descriptive text (beneficial for SEO and accessibility). Use compelling title tags and meta descriptions (persuade click-through, e.g. include action words or questions). For example:
- Meta Title: “How to Design a High-Converting Website in 2026 – Complete Guide”
- Meta Description: “Learn the latest UX/UI trends, CRO strategies, mobile-first tips, and AI personalization techniques for designing high-converting websites in 2026. Includes examples and tools.”
(Aim for ~50-60 char title, ~100-155 char description.)
- Content Freshness: Update the guide regularly (at least annually) with new stats and examples to maintain ranking. Highlight any new sections (e.g. AI in 2026) to signal freshness to Google.
Examples & Mini Case Studies
Real-world examples illustrate the impact of thoughtful redesign:
- Stepwise Redesign Yielding +250% Leads: Conversion Sciences describes a B2B eCommerce client (Wasp Barcode) who used a phased, test-driven redesign. By A/B testing copy and layout module-by-module, they boosted demo requests by 250% over six months. Notably, the conversion rate didn’t drop post-redesign (a common pitfall) – instead it tripled leads compared to the old site. This shows how incremental testing during redesign (not just after) can drive big gains.
- Before/After Metrics (Zinavo Case): Zinavo reports redesigning a service website led to significant engagement improvements. In 3 months post-launch, bounce rate fell 25% (from 68% to 39%) and average session time grew 40%. Page load time dropped from 6.2s to 2.1s, contributing to those gains. Form submissions also jumped (exact % not given) as calls-to-action became clearer. This case underscores that addressing UX issues (navigation, clarity, speed) can measurably boost conversions.
- Speed to Conversions (Flutebyte Insight): Flutebyte’s own analysis notes studies showing that even a 1-second improvement in page speed often raises conversions by ~20–30%. For example, one study found every extra second of delay cut conversions by ~20%. This quantifies the “speed = money” principle.
- Template vs Custom (Agency Comparison): Agencies like Unbounce and Go Fish Digital highlight that using conversion-optimized templates can jumpstart design. For instance, Unbounce reports that swapping to their landing page templates increased a client’s trial sign-ups by 35% (source: Unbounce case study). Meanwhile, bespoke agency work (e.g. Flutebyte’s portfolio of 300+ sites) focuses on custom UX but still follows these conversion principles. Flutebyte proudly cites that their clients have collectively generated $25M+ in online revenue from sites they’ve built. This implies that designs focused on CRO directly contribute to bottom-line ROI.
Comparative Tables
Table 1: Tool Categories & Examples (modern CRO toolkit)
| Category | Tool Examples | Purpose |
|---|---|---|
| Analytics & Reporting | Google Analytics 4, Matomo, Adobe Analytics | Traffic, funnels, conversion metrics |
| User Behavior & Heatmaps | Hotjar, Crazy Egg, Microsoft Clarity | Scrollmaps, click heatmaps, recordings |
| A/B & Multivariate Testing | Optimizely, VWO, AB Tasty, Google Optimize (deprecated) | Experimentation and optimization |
| Personalization Engines | Dynamic Yield, Adobe Target, Kameleoon | Rule-based or AI-driven content tweaks |
| Landing Page Builders | Unbounce, Webflow, Leadpages | Rapid landing page creation/testing |
| Chatbots & Live Chat | Intercom, Drift, ChatGPT-powered bots | Engage & qualify leads in real time |
Table 2: Page Templates & Layouts (common high-converting structures)
| Page Type | Key Sections | Example Focus |
|---|---|---|
| Landing Page (Lead Gen) | Hero (headline + CTA), Features/Benefits, Social Proof, Form | Single campaign goal; minimal nav |
| Homepage (Service/SaaS) | Hero, How-It-Works, Feature Blocks, Testimonials/Logos, Pricing Teaser, CTA | Broad introduction; multiple conversion paths |
| Product Page (E-commerce) | Product Images, Price, Add-to-Cart, Description, Reviews, Related Products | Highlight item USP; quick path to purchase |
| Pricing Page | Plan Comparison Table, Benefits List, FAQs, Signup CTA | Facilitate plan choice; emphasize best value |
Note: Adapt these templates to your brand and audience. Always A/B test variations (e.g. changing hero image or text) against analytics.
Table 3: Key Conversion Metrics (KPIs)
| KPI | Definition | Why It Matters |
|---|---|---|
| Conversion Rate | % of visitors completing a goal action | Core success metric for CRO; indicates overall effectiveness. |
| Bounce Rate | % who leave after viewing one page | High bounce often signals UX issues or irrelevant traffic. |
| Avg. Session Duration | Average time on site per visit | Longer sessions often correlate with higher engagement. |
| Pages per Session | Average pages viewed per visit | Higher means users explore more; indicates content interest. |
| Click-Through Rate (CTR) | % clicking a specific CTA or link | Measures the effectiveness of headlines/buttons. |
| Cart/Checkout Abandonment | % who abandon at checkout step | Key for e-commerce; identifies funnel leaks. |
| Customer Acquisition Cost (CAC) | Cost to acquire each customer | Ensures marketing spend is justified by conversion gains. |
| Life-Time Value (LTV) | Revenue per customer over time | Gauges long-term ROI of conversion improvements. |
(Industry benchmarks vary by sector; e.g., 2–3% conv. rate, ~50% bounce. Track these monthly and after each major change.)
Ready to Skyrocket Your Conversion Rates?” – Build a fast, engaging site with Flutebyte’s conversion-focused design services.